Rebuilding the EU ETS1 Calculator with River
How Climact replaced a legacy Excel model with a structured, auditable engine, ready for EU legislative negotiations in 2026.
CLIENT
Climact SA
SECTOR
Climate Policy & Regulatory Analysis
DELIVERABLE
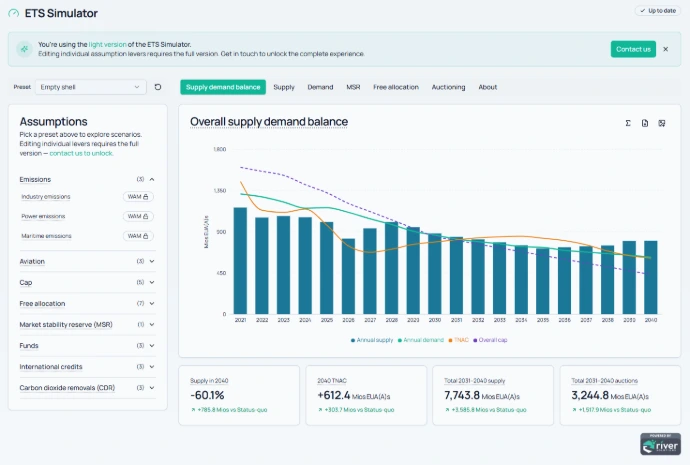
EU ETS1 scenario calculator, 2020–2040
30+
policy levers modeled
20yr
model horizon
15
model users
Published as a dynamic website.
This website is published at https://my.climact.com/tools/ets-simulator (requires registration) using the River Publisher Feature.
Get started with River
Install the trial version and test it for 14 days or let us walk you through a demo.